Changelog
Follow up on the latest improvements and updates.
RSS
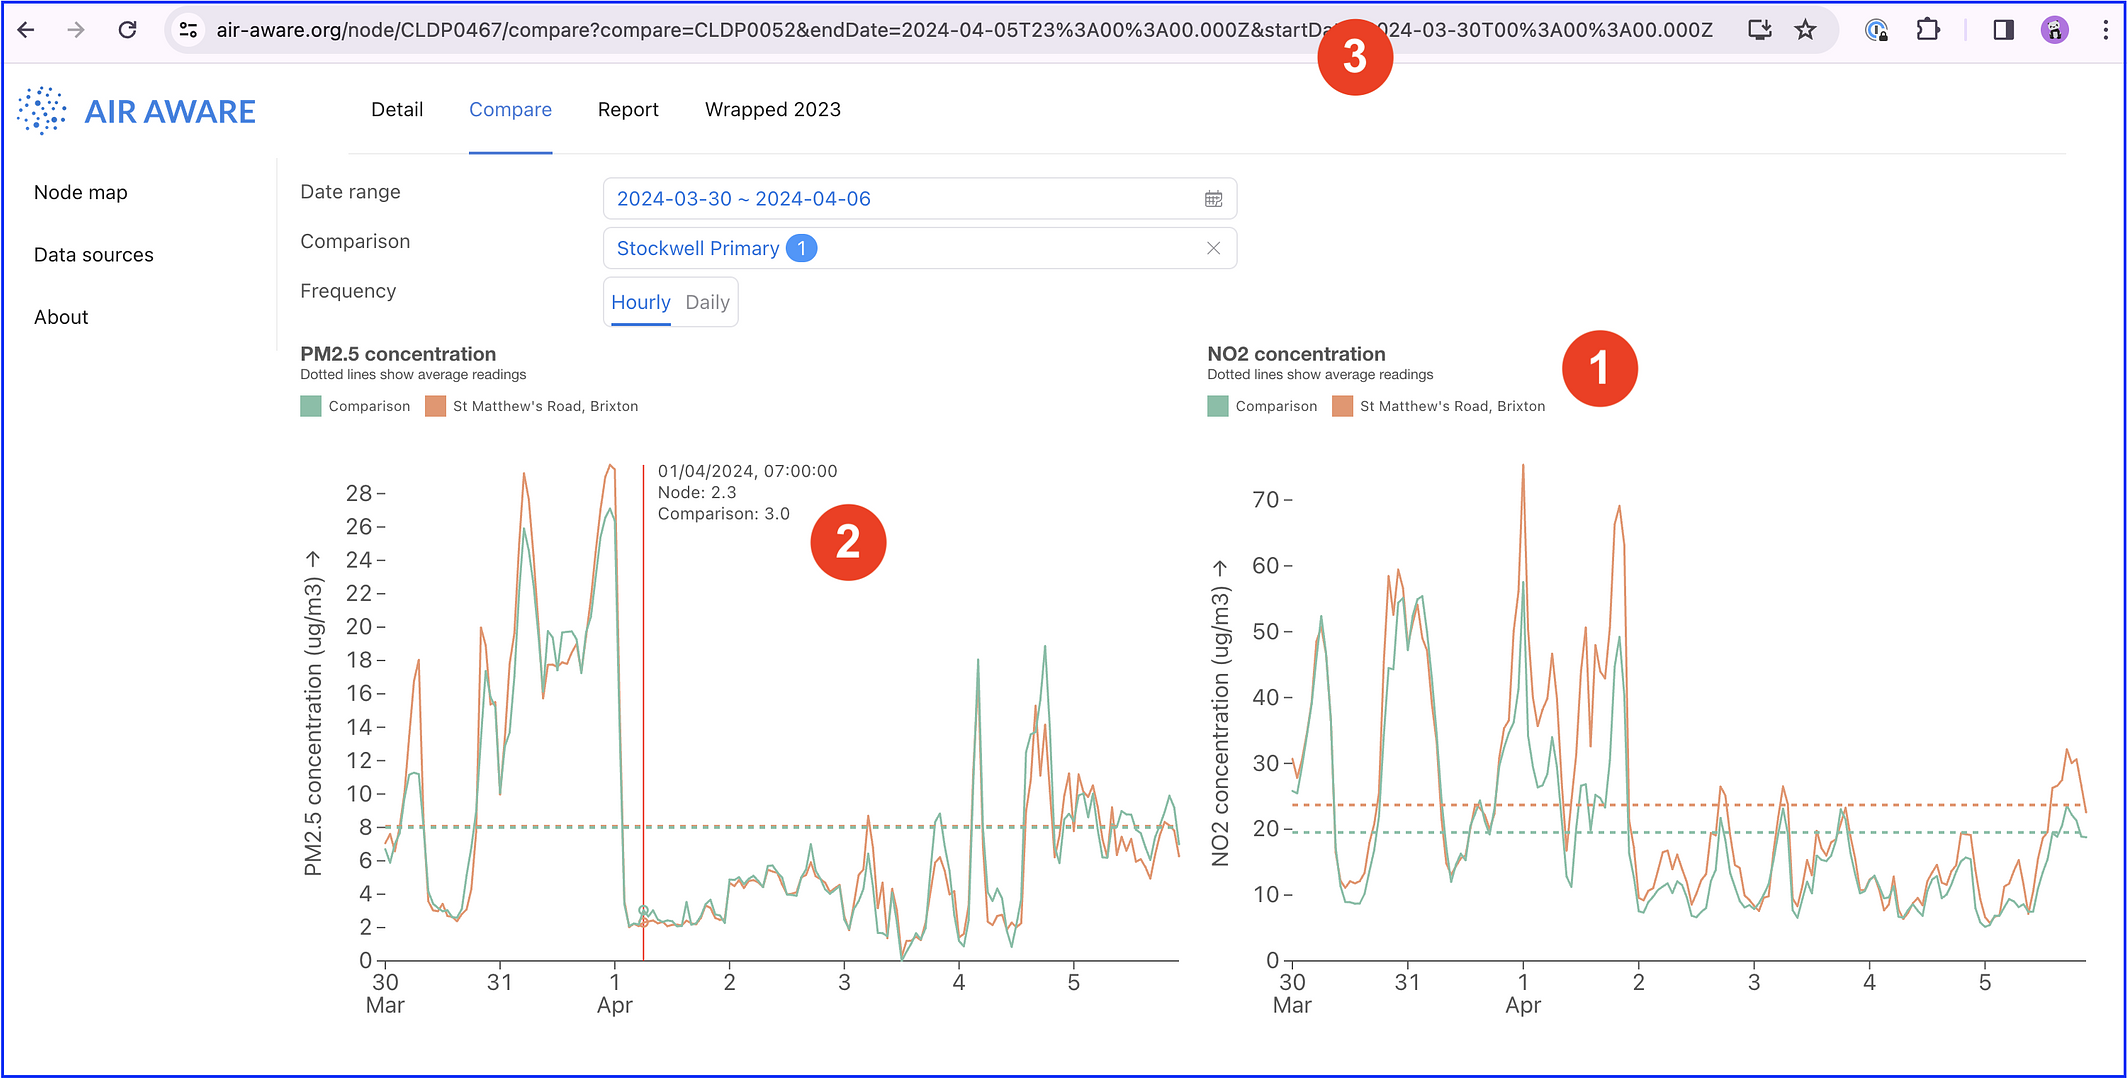
Three new features and improvements to the website this month!
- Rather than saying “Node”, the chart now has the actual name of the node. Makes it a bit clearer if you cut and paste the chart into another document.
- The text on the tooltip (when you have the cursor over the chart) is a bit smaller, so it doesn’t get cut off as much
- When you change dates and comparison nodes, this gets added to the URL, meaning that you can copy-and-paste the URL and send it to someone and they will see the same date range and comparison nodes - eg, like this

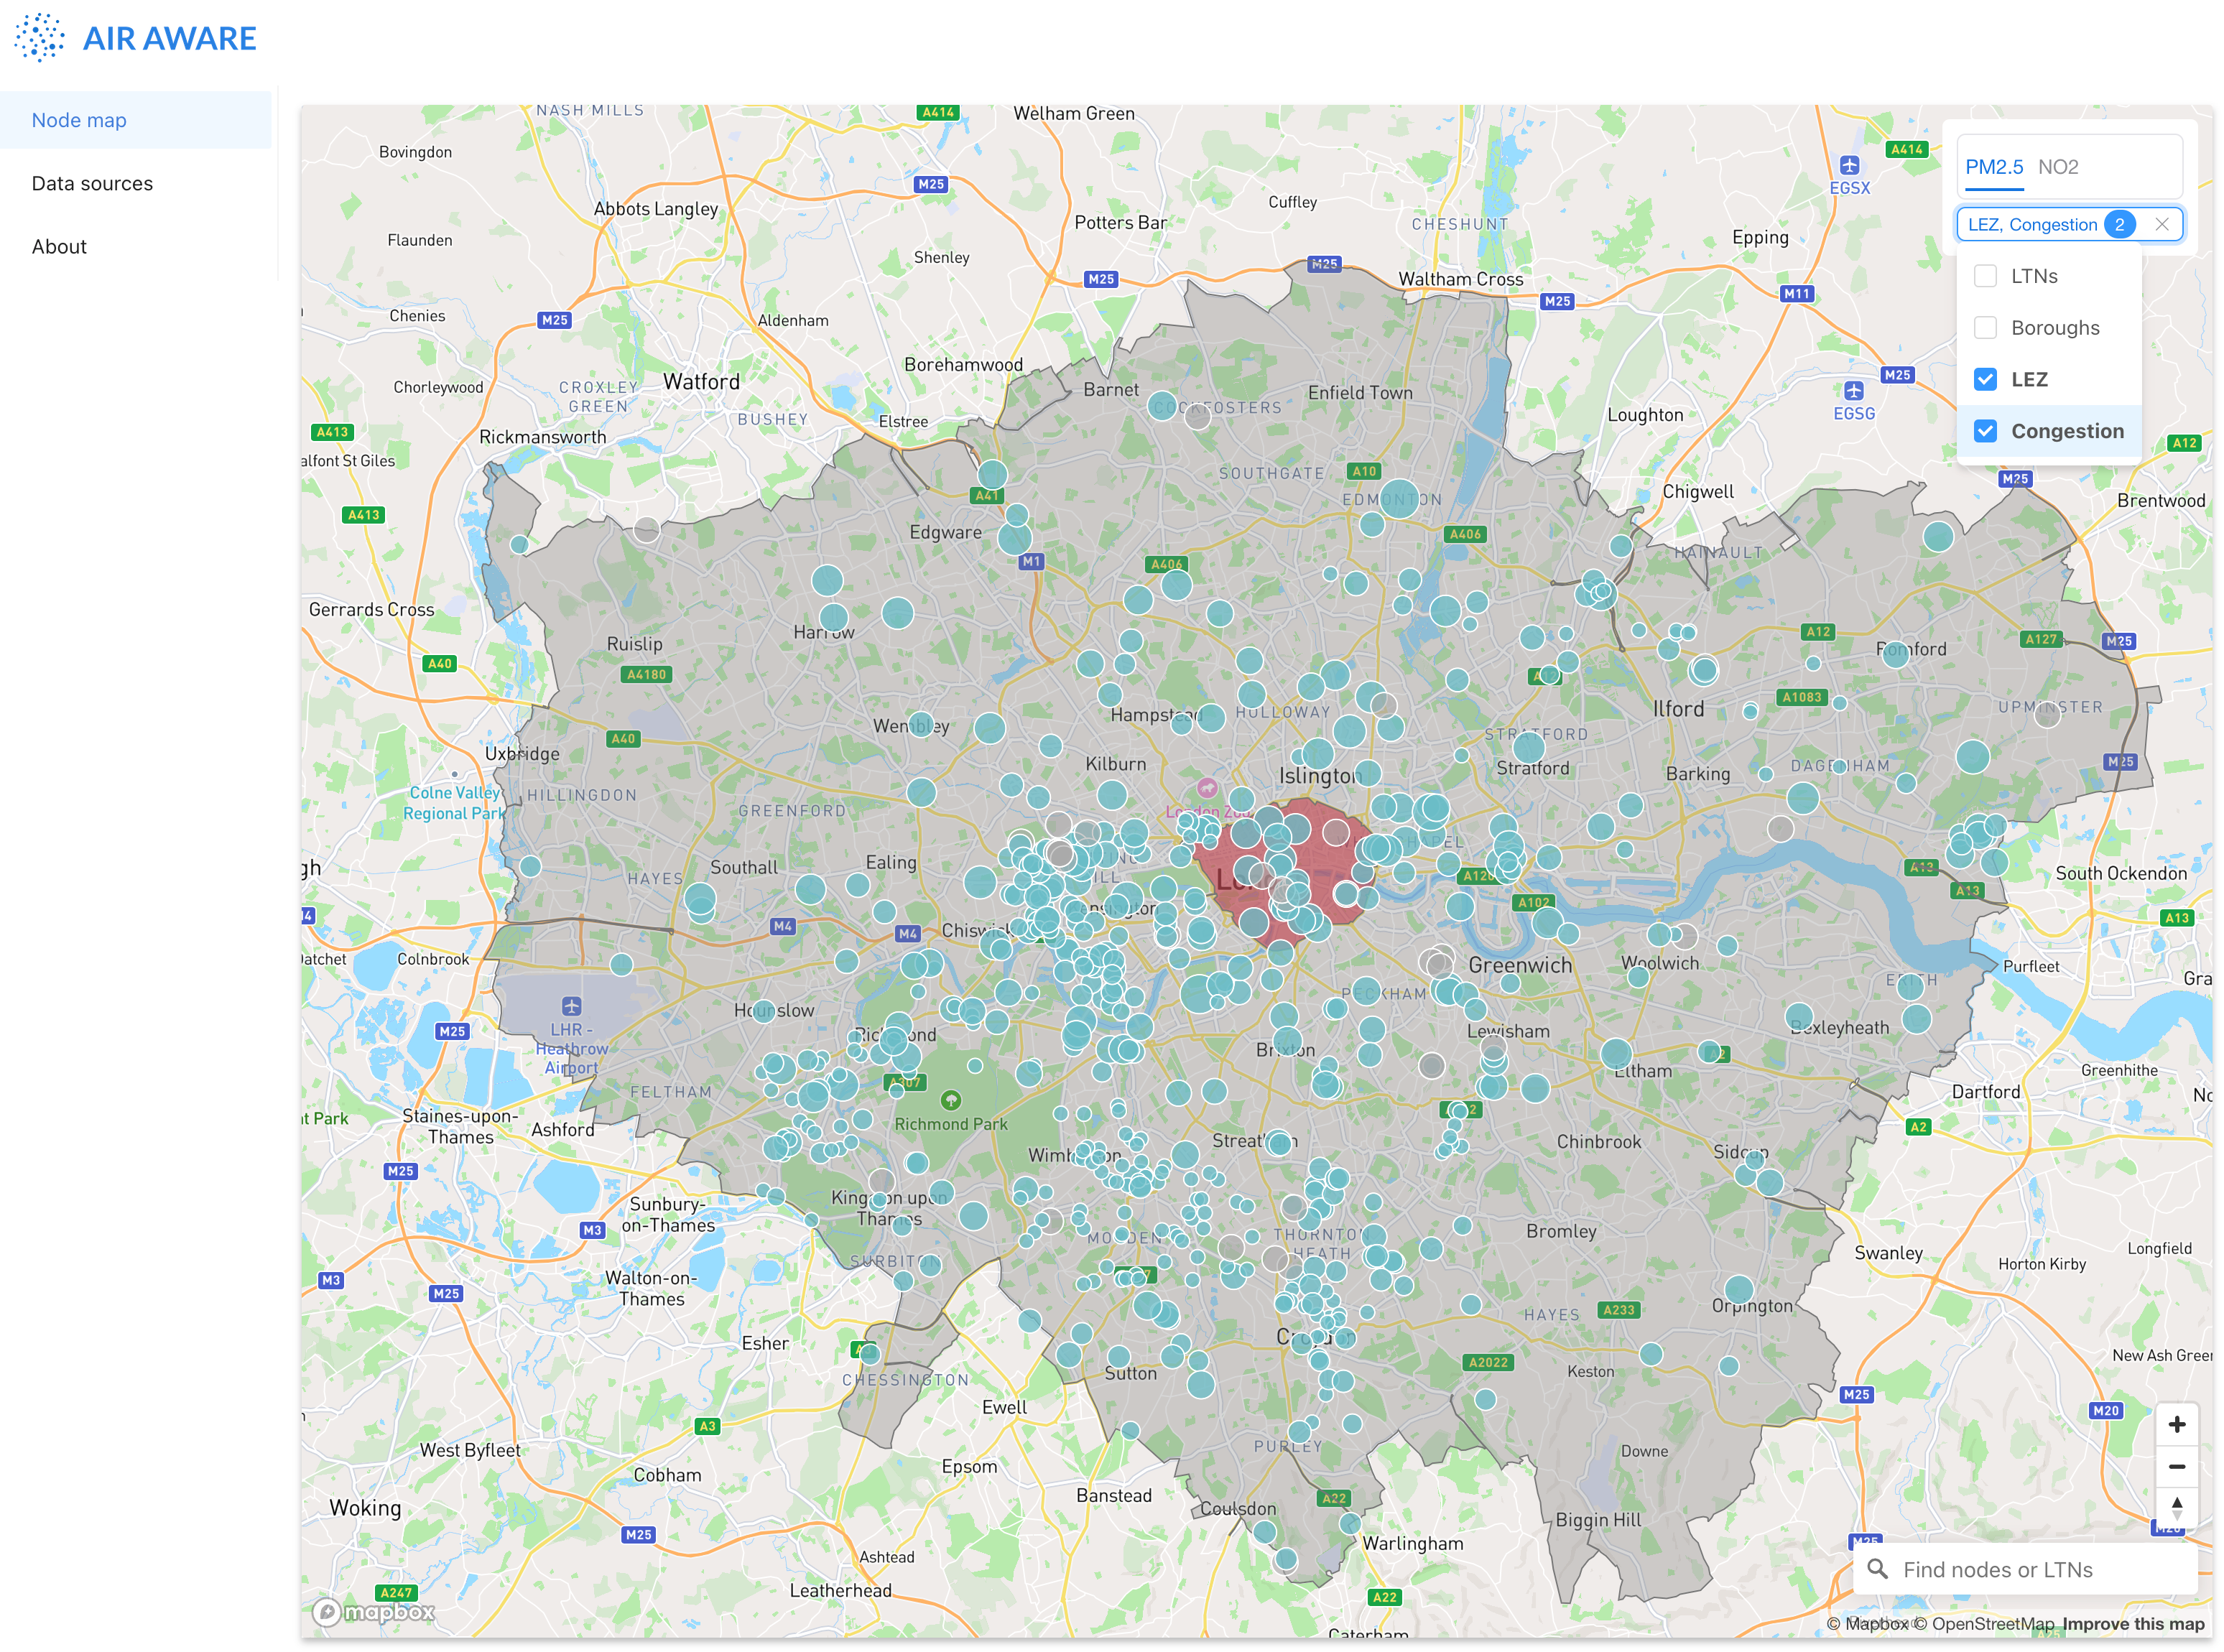
We have added the LEZ and Congestion Charging zones to the main map. If you click on Features, you can toggle the zones on and off:

Now, when you select a date range in the Compare tab, it will carry across to the Report tab, and vice-versa.
We added a few performance improvements and now the website should load a lot more quickly.
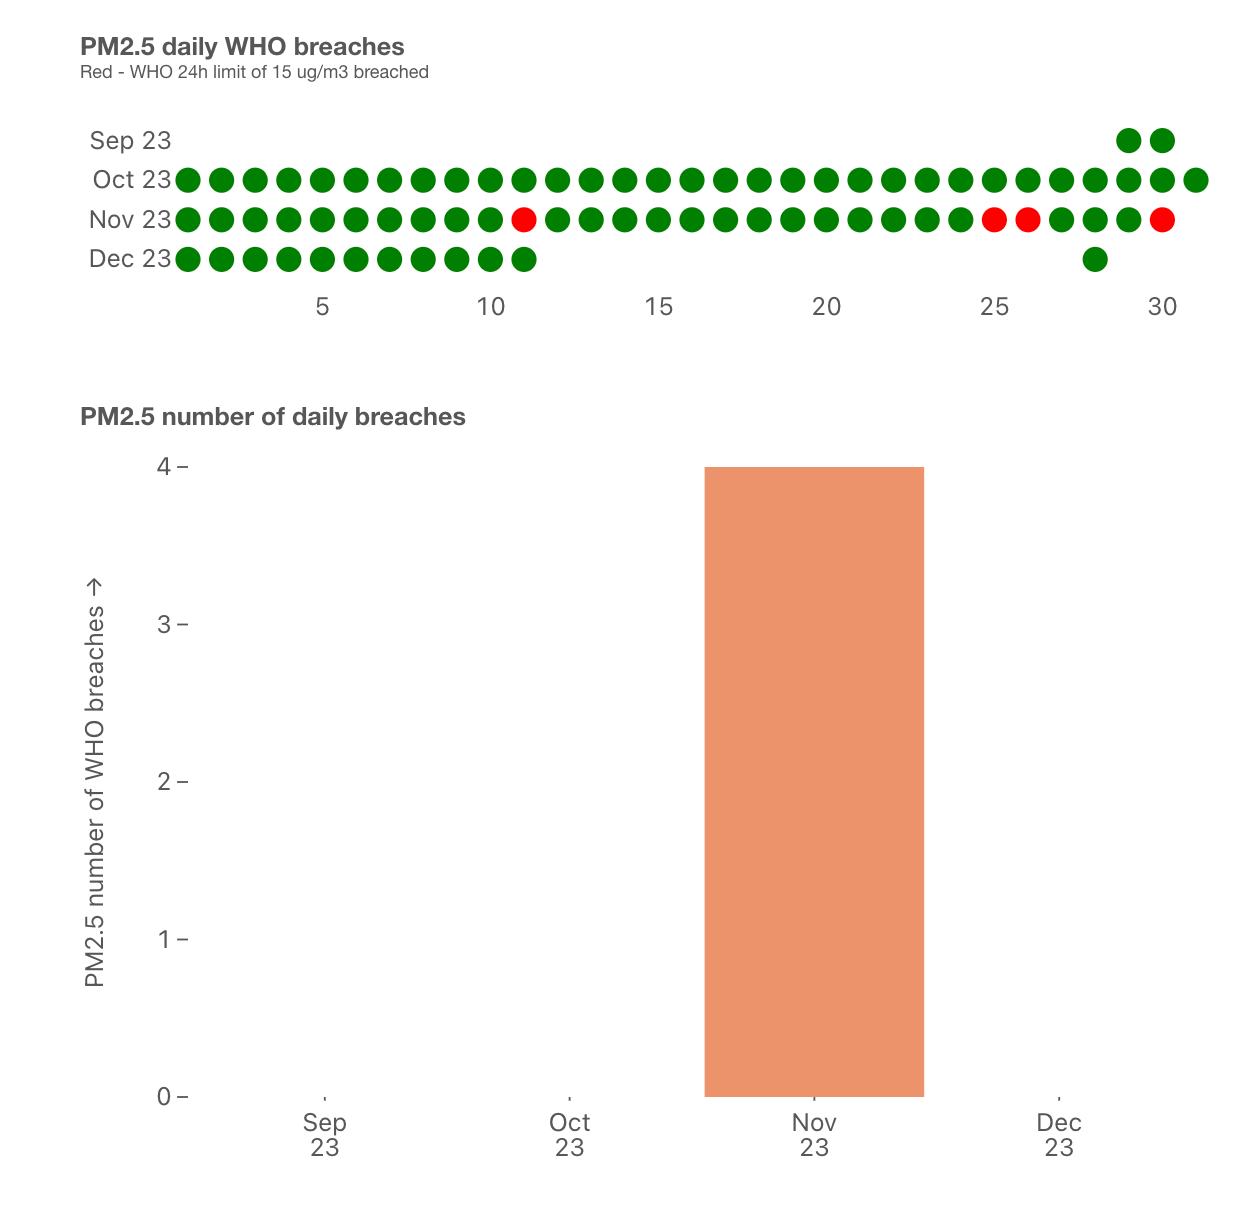
This is something that we had in the old Observable HQ plots but got missed out when we moved to the new website. It has now been added back in:

The layout of the website is now "responsive", meaning that it works on mobile devices.
We've added horizontal dotted lines to the comparison charts to make it easy to see if the selected nodes averages are higher or lower than the comparison nodes.